
For most insurance carriers, the pursuit of combined ratio improvement runs through two familiar levers: underwriting discipline and claims management. But there's a third lever, one that rarely appears on the strategic agenda, hiding inside the operational processes carriers rely on every day to acquire and service business. Inefficiencies in those processes quietly inflate the expense ratio year after year, eroding margins that tighter underwriting alone can't recover. Journey mapping for insurance carriers and service blueprinting are the tools that make this hidden cost visible. When applied with the same rigor brought to loss ratio management, these frameworks don't just surface friction; they quantify exactly how much that friction is costing you and provide a clear roadmap for insurance operational efficiency that shows up where it matters most: the combined ratio.
The combined ratio is an aggregate insurance metric that measures carrier profitability. The ratio is calculated by dividing incurred losses, loss adjustment expenses, and underwriting expenses by earned premiums.
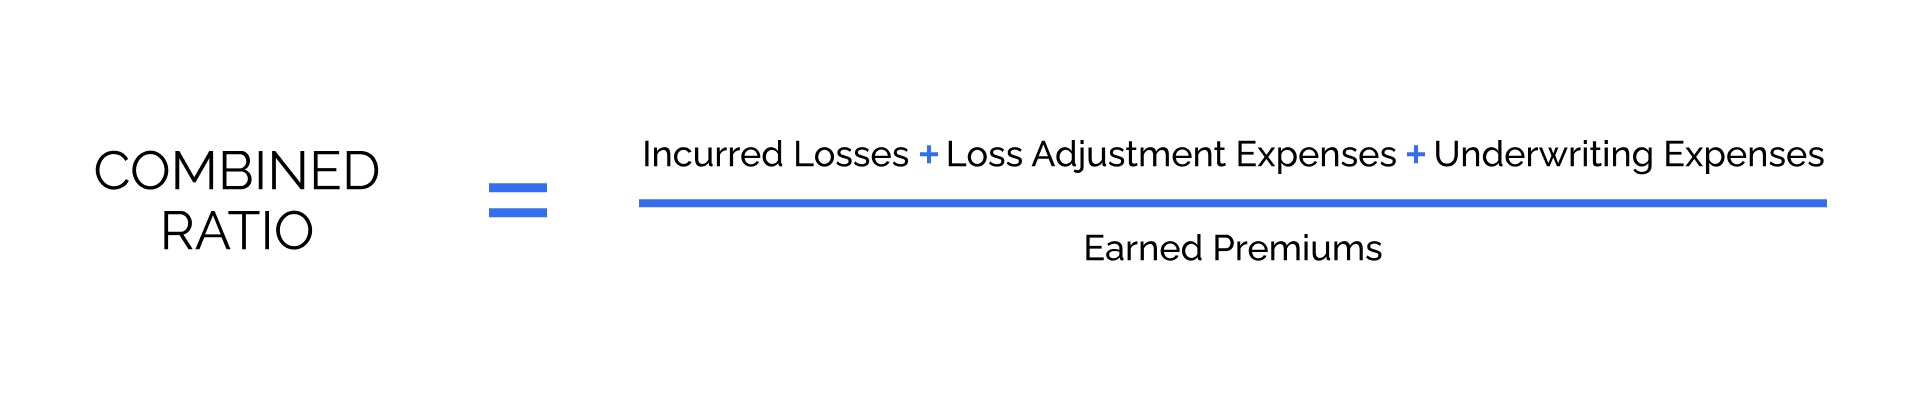
A ratio under 100% demonstrates carrier profitability, while a ratio over 100% indicates a loss, as the insurer has more in claims and expenses than it collects in premiums. Carriers can work on their combined ratio in unexpected ways. We’ll explore the most innovative ways to do so.
Let's cut through the noise. You're running an insurance carrier, which means you live and die by the combined ratio. Underwriting discipline keeps loss ratios in check. Claims management prevents leakage. But there's a third lever most carriers completely ignore, and it's costing you millions in expense ratio bloat.
I'm talking about the operational chaos buried in how you actually acquire and service business. Not the theoretical processes in your procedure manuals. The real ones, where submissions ping-pong between underwriters for a week, where agents call three times to get a simple answer, where claims adjusters waste half their day on administrative garbage instead of resolving claims.
You need two specific tools to find it and fix it: journey mapping and service blueprinting. They're different frameworks that solve different problems. Use them right, and they'll move your combined ratio in ways your finance team will actually notice.
Journey mapping shows you what your customers and distribution partners actually experience when they interact with your carrier. Not what you think happens. What actually happens: every touchpoint, every delay, every moment of friction that wastes their time and yours.
Here's why this matters for your expense ratio. Every unnecessary touchpoint costs money. Every moment of confusion generates a phone call. Every delay triggers follow-up inquiries. It all adds up to staff time that flows straight into your operating expenses.
Take new business acquisition for commercial lines. Your wholesaler submits an application through your portal. What happens next? In most carriers I've worked with, that submission sits in a queue for 2-3 days before an underwriter even opens it. Then the underwriter realizes they're missing loss runs. Email back to the wholesaler. Another two days waiting. Loss runs arrive, but now the underwriter has questions about the schedule of locations. Another email. Another delay. By the time you're ready to quote, it's been nine days, and that submission has been touched by four different people at your carrier, plus multiple rounds of back-and-forth with the distribution partner.
Map that journey honestly and calculate what it costs. An underwriter at $85K salary spends 45 minutes on a submission that should take 15 minutes. Customer service fielding status inquiry calls because the process is opaque. Wholesalers are getting frustrated and moving business to carriers with faster turnaround. That's expense ratio impact right there.
When you map the journey, you see exactly where the breakdowns occur. Maybe your submission portal doesn't actually require the documents you need, so you're playing email tag on 60% of submissions. Maybe underwriting authority guidelines are unclear, so files get escalated unnecessarily. Maybe your appetite has shifted, but nobody told the distribution partners, so you're getting submissions you'll never write.
Fix those friction points and watch what happens. One regional carrier I worked with redesigned its commercial lines intake after mapping the submission journey. They rebuilt the portal to require all necessary documentation upfront, with clear guidance on what "complete submission" actually meant. They created an automated status dashboard so wholesalers could check progress without calling. They tightened underwriting authority so fewer files needed supervisor review.
Result: Average time from submission to quote dropped from 8.5 days to 3.2 days. Underwriter capacity increased by 30% because they stopped handling incomplete submissions. Customer service call volume on "where's my quote" inquiries dropped by 40%. All of that is expense ratio improvement: real capacity freed up, real costs avoided, real efficiency gained.
The same logic applies to policy service requests. When an insured needs to add a driver or change a coverage limit, how long does that take? How many people touch it? Where does it sit? A personal lines carrier mapped their endorsement request journey and found the average request was taking 11 days to process. Not because the work was complex, but because it moved through five different queues with unclear hand-off protocols. They redesigned the workflow, consolidated ownership, and cut processing time to same-day for 80% of requests. That's the labor cost they got back.
Here's where most carriers stop. They map the customer-facing journey, make some surface improvements, and declare victory. That's a mistake. Because the real money is often hiding in the operational chaos underneath.
Service blueprinting goes deeper than journey mapping. It exposes the backstage processes, systems, and handoffs that support the customer-facing experience. This is where you find the truly expensive dysfunction: the manual workarounds, the duplicate data entry, the integration failures, the unclear procedures that create inconsistent handling.
Let's get specific. A national carrier brought me in because their claims expense ratio was trending wrong direction. Not the loss ratio. The operational cost of administering claims. We blueprinted their first-notice-of-loss through the assignment process.
What we found was insane. When a claim came in through their call center, the rep entered basic information into the claims system. Then they created a separate task in a workflow management tool to route it to the assignment team. The assignment team looked at the claim, but they couldn't see all the details from the initial call. Different system, limited integration. So they'd often need to pull the recorded call to understand what actually happened. Then they'd manually enter adjuster assignment information into a spreadsheet that tracked capacity and workload. Then they'd go back into the claims system to assign the file. Then they'd send an email to the adjuster with the assignment details because the system notification was unreliable.
One claim, seven separate manual steps, three different systems, and an average of 47 minutes from FNOL to adjuster assignment. Multiply that across 125,000 claims annually. That's 98,000 hours of administrative waste. Roughly 47 full-time equivalent employees are doing work that shouldn't exist.
The blueprint made it visible. We redesigned the process to eliminate the workflow management tool, integrated capacity tracking directly into the claims system, automated assignment based on adjuster availability and expertise, and built reliable system notifications. FNOL to assignment dropped to under 10 minutes. Administrative staffing requirements decreased by 8 FTEs in the claims organization. That's over $600K annually back into operating margin.
Service blueprinting also exposes technology debt that's killing your efficiency. A mid-size commercial lines carrier blueprinted their policy administration workflows and discovered their underwriters were entering the same information into three different systems because the carrier had grown through acquisition and never fully integrated. Rating happened in one system. Policy documents were generated from another. Billing set up in a third. Every new policy meant triple data entry and constant reconciliation when information didn't match.
They knew they had a technology problem. What they didn't know, until the blueprint made it visible, was that this was costing them 6 hours per underwriter per week. Across a team of 32 underwriters, that's nearly $750K annually in wasted capacity. The blueprint built the business case for system consolidation by showing exactly how much the current state was costing them.
Here's how this ties back to the number you actually care about.
Your combined ratio has two components. Loss ratio is about underwriting discipline and claims management. You already focus there. The expense ratio is about how efficiently you acquire and service business. Most carriers attack expense ratios with blunt instruments: hiring freezes, travel restrictions, and discretionary spending cuts. Those tactics create short-term budget relief but don't address the underlying operational inefficiency.
Journey mapping and service blueprinting attack the root cause. They show you where you're burning money on work that shouldn't exist, delays that shouldn't happen, and complexity that shouldn't be there.
Every submission that takes nine days instead of three is an opportunity cost. Premium you didn't write because the market moved or the producer placed it elsewhere. That's top-line revenue impact plus the expense of handling the submission in the first place.
Every policy service request that requires four handoffs instead of one is a labor cost you're paying unnecessarily. Multiply that across thousands of transactions monthly, and you're talking about real money. FTE capacity you could redeploy or expense you could eliminate.
Every claims process step that exists because of poor system integration is administrative overhead that has nothing to do with resolving the claim. That flows directly into your claims expense ratio.
The carriers I work with that do this right track the operational metrics that connect to expense ratio: average handling time, cost per transaction, cycle time, staff utilization, and automation rate. These aren't soft CX metrics. They're operational efficiency measures that your finance team already understands.
When you map the new business journey and reduce submission-to-quote from 8 days to 3 days, you can calculate exactly what that saves: underwriter hours freed up, customer service call volume reduced, hit ratio improved because you're responding faster. When you blueprint the claims assignment process and cut handling time by 75%, you can show the exact FTE reduction and the annual cost savings.
Here's where most insurance carriers get it wrong. They treat journey mapping and service blueprinting like CX team exercises. Interesting insights, nice diagrams, recommendations that never get implemented because they threaten how things currently work.
That's backwards. You're looking at an operational efficiency initiative that happens to use CX frameworks. The goal is to eliminate waste, reduce cycle time, and free up capacity that's currently trapped in broken processes. Whether people feel better about their experience is a side benefit. What matters is pulling real dollars out of your expense base.
This means you need executive sponsorship from operations leaders who control the budgets and resources to actually fix what gets uncovered. Your CFO needs to care about the findings because they directly impact the expense ratio targets in the operating plan. Every insight needs to connect to hard-dollar impact so finance can track whether the improvements actually delivered the projected savings.
It also means being willing to confront uncomfortable truths. Journey maps and service blueprints will expose legacy systems that need replacement. Organizational silos that create handoff failures. Procedures that made sense 15 years ago but now just create friction. Product designs that make servicing unnecessarily complex.
The carriers that win are the ones that act on what they find. Even when it's hard, even when it requires investment, even when it means admitting that how you've been operating isn't working.
Your competitors are attacking the expense ratio with hiring freezes and budget cuts. You can attack it with precision. Use journey mapping to find the customer and agent friction that's costing you money, and service blueprinting to fix the operational chaos underneath. The combined ratio improvement isn't theoretical. It shows up in reduced handling costs, faster cycle times, and better capacity utilization.
The question is whether you're ready to look honestly at how work really happens in your carrier and make the changes required to fix it.
For most insurance carriers, the pursuit of combined ratio improvement runs through two familiar levers: underwriting discipline and claims management. But there's a third lever, one that rarely appears on the strategic agenda, hiding inside the operational processes carriers rely on every day to acquire and service business. Inefficiencies in those processes quietly inflate the expense ratio year after year, eroding margins that tighter underwriting alone can't recover. Journey mapping for insurance carriers and service blueprinting are the tools that make this hidden cost visible. When applied with the same rigor brought to loss ratio management, these frameworks don't just surface friction; they quantify exactly how much that friction is costing you and provide a clear roadmap for insurance operational efficiency that shows up where it matters most: the combined ratio.
The combined ratio is an aggregate insurance metric that measures carrier profitability. The ratio is calculated by dividing incurred losses, loss adjustment expenses, and underwriting expenses by earned premiums.
A ratio under 100% demonstrates carrier profitability, while a ratio over 100% indicates a loss, as the insurer has more in claims and expenses than it collects in premiums. Carriers can work on their combined ratio in unexpected ways. We’ll explore the most innovative ways to do so.
Let's cut through the noise. You're running an insurance carrier, which means you live and die by the combined ratio. Underwriting discipline keeps loss ratios in check. Claims management prevents leakage. But there's a third lever most carriers completely ignore, and it's costing you millions in expense ratio bloat.
I'm talking about the operational chaos buried in how you actually acquire and service business. Not the theoretical processes in your procedure manuals. The real ones, where submissions ping-pong between underwriters for a week, where agents call three times to get a simple answer, where claims adjusters waste half their day on administrative garbage instead of resolving claims.
You need two specific tools to find it and fix it: journey mapping and service blueprinting. They're different frameworks that solve different problems. Use them right, and they'll move your combined ratio in ways your finance team will actually notice.
Journey mapping shows you what your customers and distribution partners actually experience when they interact with your carrier. Not what you think happens. What actually happens: every touchpoint, every delay, every moment of friction that wastes their time and yours.
Here's why this matters for your expense ratio. Every unnecessary touchpoint costs money. Every moment of confusion generates a phone call. Every delay triggers follow-up inquiries. It all adds up to staff time that flows straight into your operating expenses.
Take new business acquisition for commercial lines. Your wholesaler submits an application through your portal. What happens next? In most carriers I've worked with, that submission sits in a queue for 2-3 days before an underwriter even opens it. Then the underwriter realizes they're missing loss runs. Email back to the wholesaler. Another two days waiting. Loss runs arrive, but now the underwriter has questions about the schedule of locations. Another email. Another delay. By the time you're ready to quote, it's been nine days, and that submission has been touched by four different people at your carrier, plus multiple rounds of back-and-forth with the distribution partner.
Map that journey honestly and calculate what it costs. An underwriter at $85K salary spends 45 minutes on a submission that should take 15 minutes. Customer service fielding status inquiry calls because the process is opaque. Wholesalers are getting frustrated and moving business to carriers with faster turnaround. That's expense ratio impact right there.
When you map the journey, you see exactly where the breakdowns occur. Maybe your submission portal doesn't actually require the documents you need, so you're playing email tag on 60% of submissions. Maybe underwriting authority guidelines are unclear, so files get escalated unnecessarily. Maybe your appetite has shifted, but nobody told the distribution partners, so you're getting submissions you'll never write.
Fix those friction points and watch what happens. One regional carrier I worked with redesigned its commercial lines intake after mapping the submission journey. They rebuilt the portal to require all necessary documentation upfront, with clear guidance on what "complete submission" actually meant. They created an automated status dashboard so wholesalers could check progress without calling. They tightened underwriting authority so fewer files needed supervisor review.
Result: Average time from submission to quote dropped from 8.5 days to 3.2 days. Underwriter capacity increased by 30% because they stopped handling incomplete submissions. Customer service call volume on "where's my quote" inquiries dropped by 40%. All of that is expense ratio improvement: real capacity freed up, real costs avoided, real efficiency gained.
The same logic applies to policy service requests. When an insured needs to add a driver or change a coverage limit, how long does that take? How many people touch it? Where does it sit? A personal lines carrier mapped their endorsement request journey and found the average request was taking 11 days to process. Not because the work was complex, but because it moved through five different queues with unclear hand-off protocols. They redesigned the workflow, consolidated ownership, and cut processing time to same-day for 80% of requests. That's the labor cost they got back.
Here's where most carriers stop. They map the customer-facing journey, make some surface improvements, and declare victory. That's a mistake. Because the real money is often hiding in the operational chaos underneath.
Service blueprinting goes deeper than journey mapping. It exposes the backstage processes, systems, and handoffs that support the customer-facing experience. This is where you find the truly expensive dysfunction: the manual workarounds, the duplicate data entry, the integration failures, the unclear procedures that create inconsistent handling.
Let's get specific. A national carrier brought me in because their claims expense ratio was trending wrong direction. Not the loss ratio. The operational cost of administering claims. We blueprinted their first-notice-of-loss through the assignment process.
What we found was insane. When a claim came in through their call center, the rep entered basic information into the claims system. Then they created a separate task in a workflow management tool to route it to the assignment team. The assignment team looked at the claim, but they couldn't see all the details from the initial call. Different system, limited integration. So they'd often need to pull the recorded call to understand what actually happened. Then they'd manually enter adjuster assignment information into a spreadsheet that tracked capacity and workload. Then they'd go back into the claims system to assign the file. Then they'd send an email to the adjuster with the assignment details because the system notification was unreliable.
One claim, seven separate manual steps, three different systems, and an average of 47 minutes from FNOL to adjuster assignment. Multiply that across 125,000 claims annually. That's 98,000 hours of administrative waste. Roughly 47 full-time equivalent employees are doing work that shouldn't exist.
The blueprint made it visible. We redesigned the process to eliminate the workflow management tool, integrated capacity tracking directly into the claims system, automated assignment based on adjuster availability and expertise, and built reliable system notifications. FNOL to assignment dropped to under 10 minutes. Administrative staffing requirements decreased by 8 FTEs in the claims organization. That's over $600K annually back into operating margin.
Service blueprinting also exposes technology debt that's killing your efficiency. A mid-size commercial lines carrier blueprinted their policy administration workflows and discovered their underwriters were entering the same information into three different systems because the carrier had grown through acquisition and never fully integrated. Rating happened in one system. Policy documents were generated from another. Billing set up in a third. Every new policy meant triple data entry and constant reconciliation when information didn't match.
They knew they had a technology problem. What they didn't know, until the blueprint made it visible, was that this was costing them 6 hours per underwriter per week. Across a team of 32 underwriters, that's nearly $750K annually in wasted capacity. The blueprint built the business case for system consolidation by showing exactly how much the current state was costing them.
Here's how this ties back to the number you actually care about.
Your combined ratio has two components. Loss ratio is about underwriting discipline and claims management. You already focus there. The expense ratio is about how efficiently you acquire and service business. Most carriers attack expense ratios with blunt instruments: hiring freezes, travel restrictions, and discretionary spending cuts. Those tactics create short-term budget relief but don't address the underlying operational inefficiency.
Journey mapping and service blueprinting attack the root cause. They show you where you're burning money on work that shouldn't exist, delays that shouldn't happen, and complexity that shouldn't be there.
Every submission that takes nine days instead of three is an opportunity cost. Premium you didn't write because the market moved or the producer placed it elsewhere. That's top-line revenue impact plus the expense of handling the submission in the first place.
Every policy service request that requires four handoffs instead of one is a labor cost you're paying unnecessarily. Multiply that across thousands of transactions monthly, and you're talking about real money. FTE capacity you could redeploy or expense you could eliminate.
Every claims process step that exists because of poor system integration is administrative overhead that has nothing to do with resolving the claim. That flows directly into your claims expense ratio.
The carriers I work with that do this right track the operational metrics that connect to expense ratio: average handling time, cost per transaction, cycle time, staff utilization, and automation rate. These aren't soft CX metrics. They're operational efficiency measures that your finance team already understands.
When you map the new business journey and reduce submission-to-quote from 8 days to 3 days, you can calculate exactly what that saves: underwriter hours freed up, customer service call volume reduced, hit ratio improved because you're responding faster. When you blueprint the claims assignment process and cut handling time by 75%, you can show the exact FTE reduction and the annual cost savings.
Here's where most insurance carriers get it wrong. They treat journey mapping and service blueprinting like CX team exercises. Interesting insights, nice diagrams, recommendations that never get implemented because they threaten how things currently work.
That's backwards. You're looking at an operational efficiency initiative that happens to use CX frameworks. The goal is to eliminate waste, reduce cycle time, and free up capacity that's currently trapped in broken processes. Whether people feel better about their experience is a side benefit. What matters is pulling real dollars out of your expense base.
This means you need executive sponsorship from operations leaders who control the budgets and resources to actually fix what gets uncovered. Your CFO needs to care about the findings because they directly impact the expense ratio targets in the operating plan. Every insight needs to connect to hard-dollar impact so finance can track whether the improvements actually delivered the projected savings.
It also means being willing to confront uncomfortable truths. Journey maps and service blueprints will expose legacy systems that need replacement. Organizational silos that create handoff failures. Procedures that made sense 15 years ago but now just create friction. Product designs that make servicing unnecessarily complex.
The carriers that win are the ones that act on what they find. Even when it's hard, even when it requires investment, even when it means admitting that how you've been operating isn't working.
Your competitors are attacking the expense ratio with hiring freezes and budget cuts. You can attack it with precision. Use journey mapping to find the customer and agent friction that's costing you money, and service blueprinting to fix the operational chaos underneath. The combined ratio improvement isn't theoretical. It shows up in reduced handling costs, faster cycle times, and better capacity utilization.
The question is whether you're ready to look honestly at how work really happens in your carrier and make the changes required to fix it.

